C2P Reports
Capture2Proposal has developed a set of C2P Reports which are designed to give you insights into your Pipeline Performance. We believe these reports will not only be valuable as-is, but can also serve as an inspiration for you and your team. Find the reports by going to the dropdown in the top left corner of the pipeline page, and scrolling down to the section titled C2P Reports.
The reports currently available in C2P are below. Or, for a video version, click here.
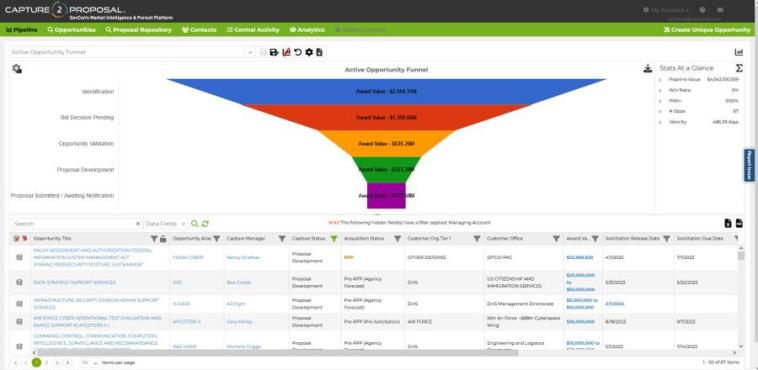
A healthy pipeline should be a funnel! Early in the process, you will review many opportunities. Given the limited information available then, you want to cast a wide net. With each stage in the capture process you gather more information that helps you focus and reject the opportunities where your probability of win is low. The funnel chart provides a great snapshot view of your work and whether this process is being maintained.
Our funnel chart uses award value as the driving factor for the funnel, but you could also use opportunity count. Award value is nice because it gives an indication for the monetary health of the projects as well as the amount of work, however, a single large project moving through the statuses may skew the shape of the funnel along the way.
Some great options to customize this chart are to either use the count of opportunities in each status in lieu of the Award Value, or to trade out the standard Award Value field with your own custom Award Value field that more accurately represents the portion of the award you expect to receive. Adding the average PWin to the visible data in each status band is a great way to ensure your team is both updating the value and selecting the most likely wins to make it through each round in the proposal development process.
Understanding the workload and evaluation techniques each of your Capture Managers employs is important to making smart decisions. This report group is primarily designed for BD Managers, although it may help Capture Managers evaluate their own work as well.
There are four separate reports in this group, each meant to highlight a different characteristic of your pipeline based on the Capture Managers and Business Developers who are building the pipeline.
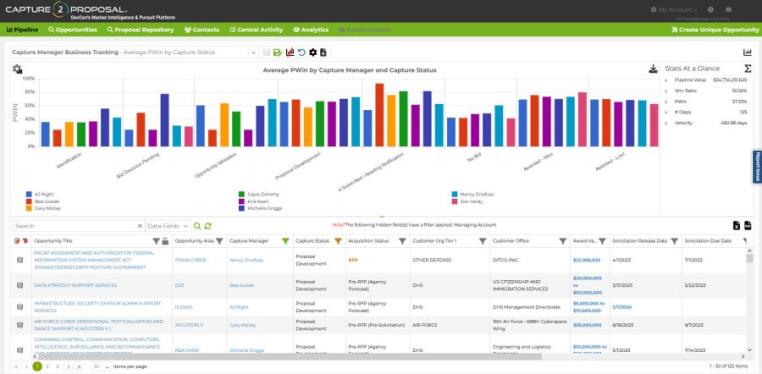
This first report, Average PWin by Capture Status, is about using the tools in your arsenal effectively to make the best decisions possible.
We know that the probably of win should go up at each stage in the capture process. Otherwise, we’re not using our resources most effectively. However, different capture managers will evaluate the risk differently, and may evaluate PWin differently. One Capture Manager’s 50% may be the same as another Capture Manager’s 65%. Using a standard Pwin measure to make a go/no-go decision may not work without also considering the manager behind the opportunity, and their own risk tolerance. This report is great for understanding how to use the Capture Manager’s risk tolerance as part of the decision-making process. It is also a great way to quickly see if your Capture Managers are using the field and updating it appropriately throughout the opportunity lifecycle.
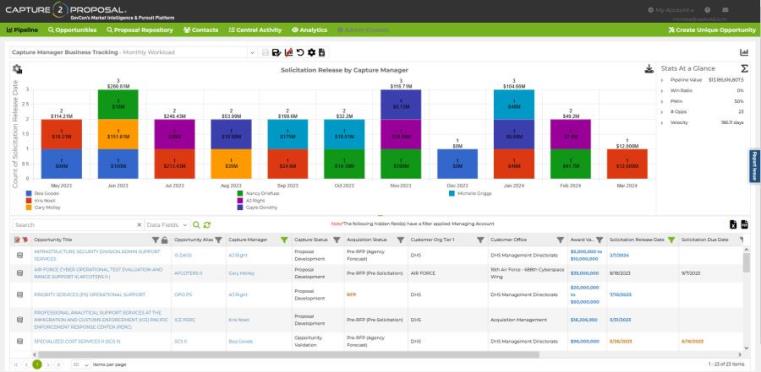
As the title of the Monthly Workload report states, this report is great for time and resource management. It is a count of opportunities with a solicitation release date in each of the next 18 months for each Capture Manager. This is a great way to help determine when you need to shuffle valuable opportunities to different team members to prevent overloading one manager with too many high-value proposals dropping at once, or when you may need to drop a low value opportunity to keep your team focused on those with the highest expected value.
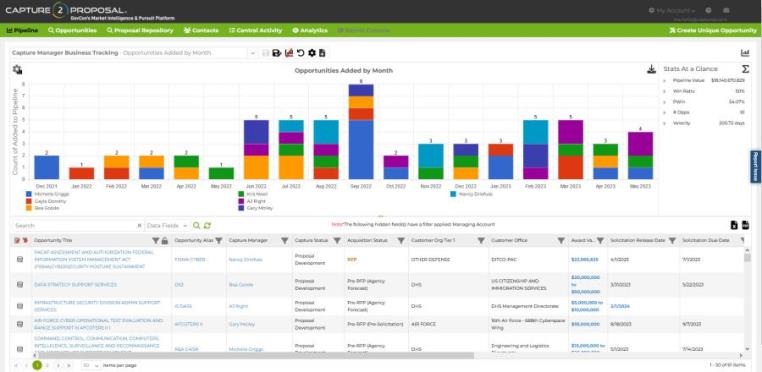
This report is similar in look to the previous one, but this time, it’s measuring the number of opportunities each Business Developers has added to the company pipeline each month. This is a great way to see how aggressive your team is at identifying new opportunities in the pipeline. If your team has responsibilities divided by business category or Contract Vehicle, it is also a great way to judge which areas are growing or shrinking at any given time. This report combined with the active opportunity funnel is a great way to evaluate your medium to long-term pipeline and prospects. If you have one team member dedicated to finding new opportunities, this report can still be used for that purpose even without the added benefit of seeing the upcoming workload for each of your team members.
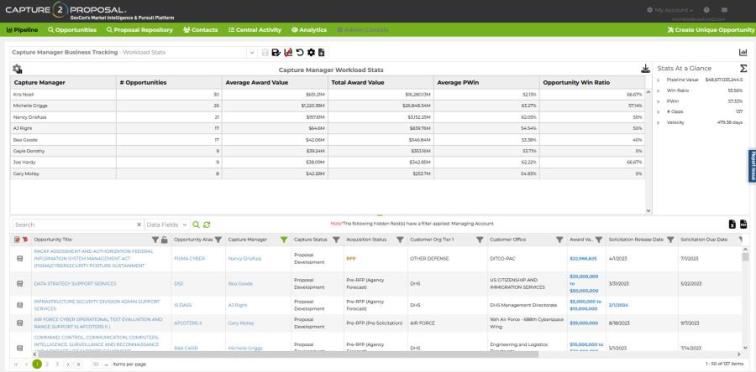
The final report in this group is a table that gives a quick summary of your team stats. How many opportunities fall to each Capture Manager? What is the average value, and the total value of the opportunities? What is the Average Pwin? What is the Capture Manager’s win ratio? This is a great snapshot view that can give a quick perspective on a number of variables that come together to help you balance your team effectively. Using Average PWin and Opportunity Win Ratio together is one of my favorite ways to judge whether a Capture Manager is effectively promoting the right opportunities to be bid, and dropping the opportunities they know have a low probability of win.
We all know the time and effort to win a spot on a contract vehicle is significant. Make the best decisions on which vehicles to chase based on your performance on current vehicles. We’re always tempted to pursue a vehicle just because we won a spot on the predecessor. But if you’re not winning work on that vehicle, why spend more money, time, and resources to get on the next iteration and face more of the same? This report group features a series of reports that will help you evaluate your team’s performance and pursuit efforts on each of your current and previous contract vehicles.
While the number of contract vehicles shown in the images for these reports below are far larger than the average number of active contract vehicles for the typical government contractor, the reports may show a combination of active and expired vehicles, teamed opportunities, and other factors that allow for a greater number of vehicles. Do not be surprised to see a graphs with fewer contract vehicles when you run the reports on your own dataset.
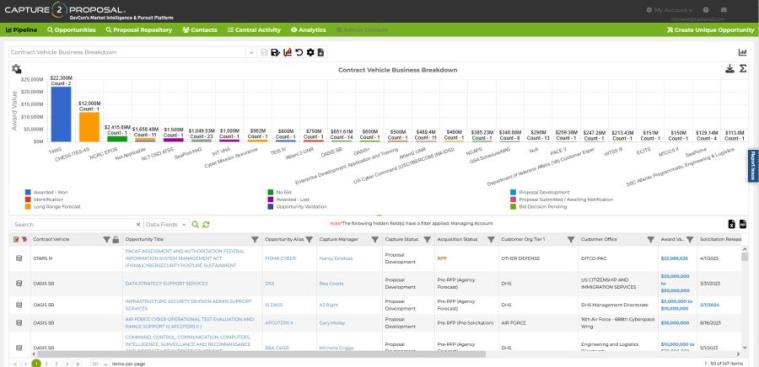
This is the breakdown of opportunities in your pipeline in each contract vehicle: How many opportunities are you chasing that fall within the vehicle, and how much are they worth? While the chart uses the award value as the driving factor, it is important to look at the count of opportunities as well. Knowing where most of the work is in your pipeline is important when making decisions about which follow-on vehicles to chase.
This report is one of the most valuable C2P reports for making decisions about your pipeline. Each column represents all of the opportunities you've chased or are currently chasing in a given contract vehicle. New vehicles, such as OASIS+, will not show in this view since there are no opportunities available under it yet.* This gives you great insight into which vehicles are important to your business, and what work you're chasing on them right now. For expired vehicles, such as Seaport-e, we can see in this chart that the company bid on four delivery orders through the vehicle, and won three. There was no question that when Seaport-NxG was released that this company should bid for a spot on the vehicle! Success was mixed on the various schedules that have now combined into the GSA Multiple Award Schedule (MAS), so deciding which SINs to chase there might have been greatly influenced by where work had been won in the past.
Using TOR Integration to have the best information available on all of the work withing your contract vehicles is a great way to improve the accuracy of this report!
*If you have built a unique opportunity, or have a pre-forecasted opportunity that lists a not-yet-awarded Contract Vehicle as its parent, then the vehicle and opportunity will show in this report.
This is another great snapshot report on the opportunities that have been awarded from your pipeline. What award types dominate, and what is your success on the bids? Fine -tuning your process and making bid decisions based on your previous success rates is a great way to ensure the future health of your pipeline.
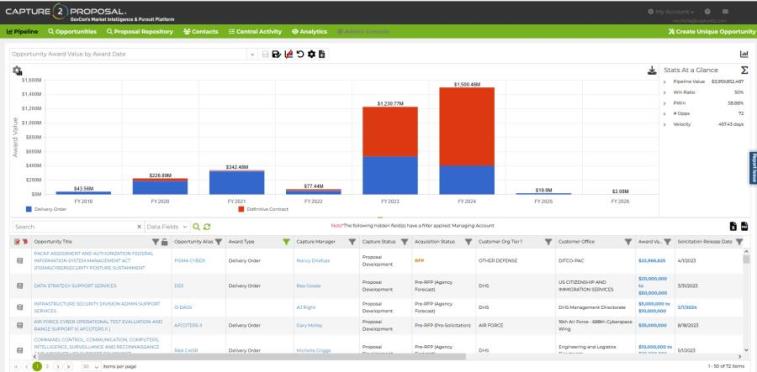
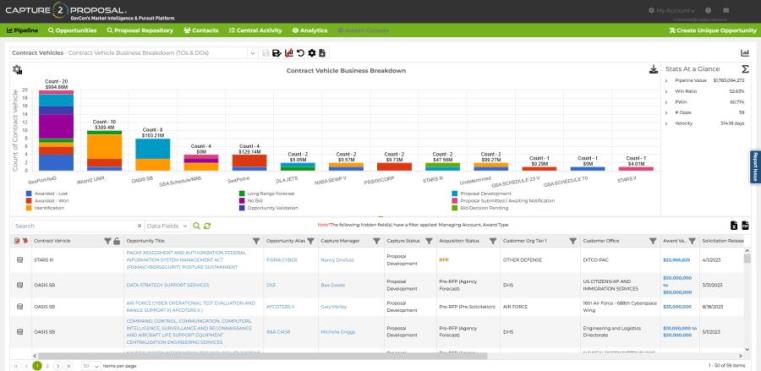
Given you current work, do you have enough work coming down the pipeline to support your company's goals? Using stats at a glance on the right, you can see that the company in the image above has a 50% Win Ratio, defined as the (Number of Wins/(Number of Awarded Bids). How many opportunities do you normally choose not to bid along the road? This chart is a quick view of the work in your pipeline to help you gauge whether there are enough projects coming down the pipeline to keep the work flowing at the desired rate, given your past success. Note that this report omits Contract Vehicles and focuses on the contracts with true work orders attached.
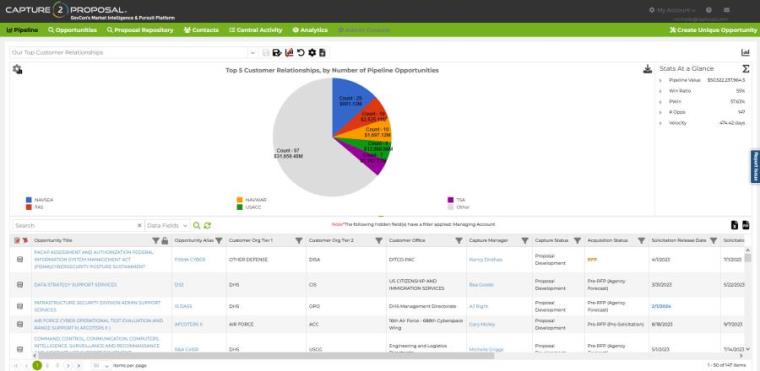
Who are the customers you support the most, or that control most of the work you are chasing? Ensuring that you have a great relationship with your top five customers is critical. Knowing how much work they account for out of your entire company pipeline is also key to understanding your company's growth and potential. If these relationships aren't good, it's time to start cultivating new relationships and looking at which other customers support the work you do for ensuring the health of your pipeline going forward. Start here, then use award analytics to do a deeper dive in the contracts each of these customers support. Get a full picture of the organizations in your workspace.
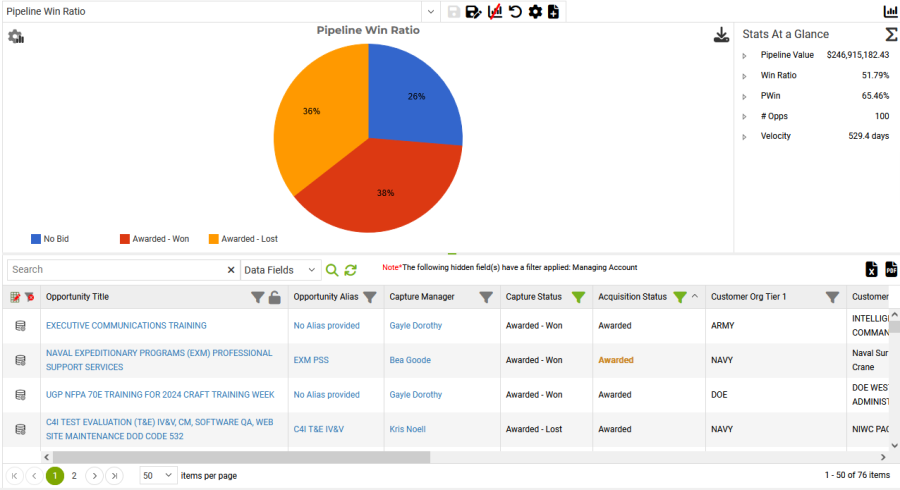
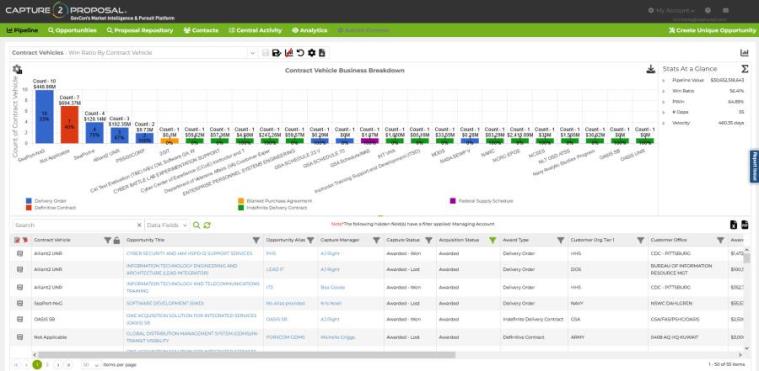
What is your win rate like for opportunities in your pipeline? This report uses all of your inactive capture statuses to show the percentage of opportunities that you need in your pipeline to achieve your ideal win rate. If you have wins and losses split by Prime vs Sub awards, you will see all of those categories as well. Including No Bids is a great way to see how many opps you start chasing that aren't the right fit for you in the end as well. There's a lot of great information on how to improve your business to be found in this simple little pie chart!
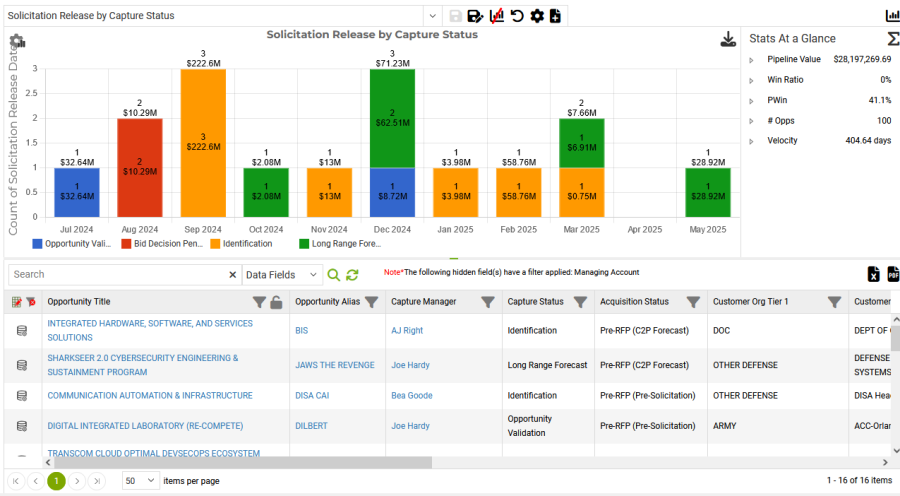
Are you keeping a close watch on your opportunities with Solicitation Release Dates coming up this year? This report shows your opportunities by solicitation release date and capture status so you can ensure that you're moving the right information forward to make those bid decisions and start proposal development on time. Don't wait until it's too late!
C2P Reports may also be available upon request on our Award Analytics Page based on recent Capture2Proposal outlook reports.